Snapshots
Full-system diagnostic snapshots with interactive HTML reports
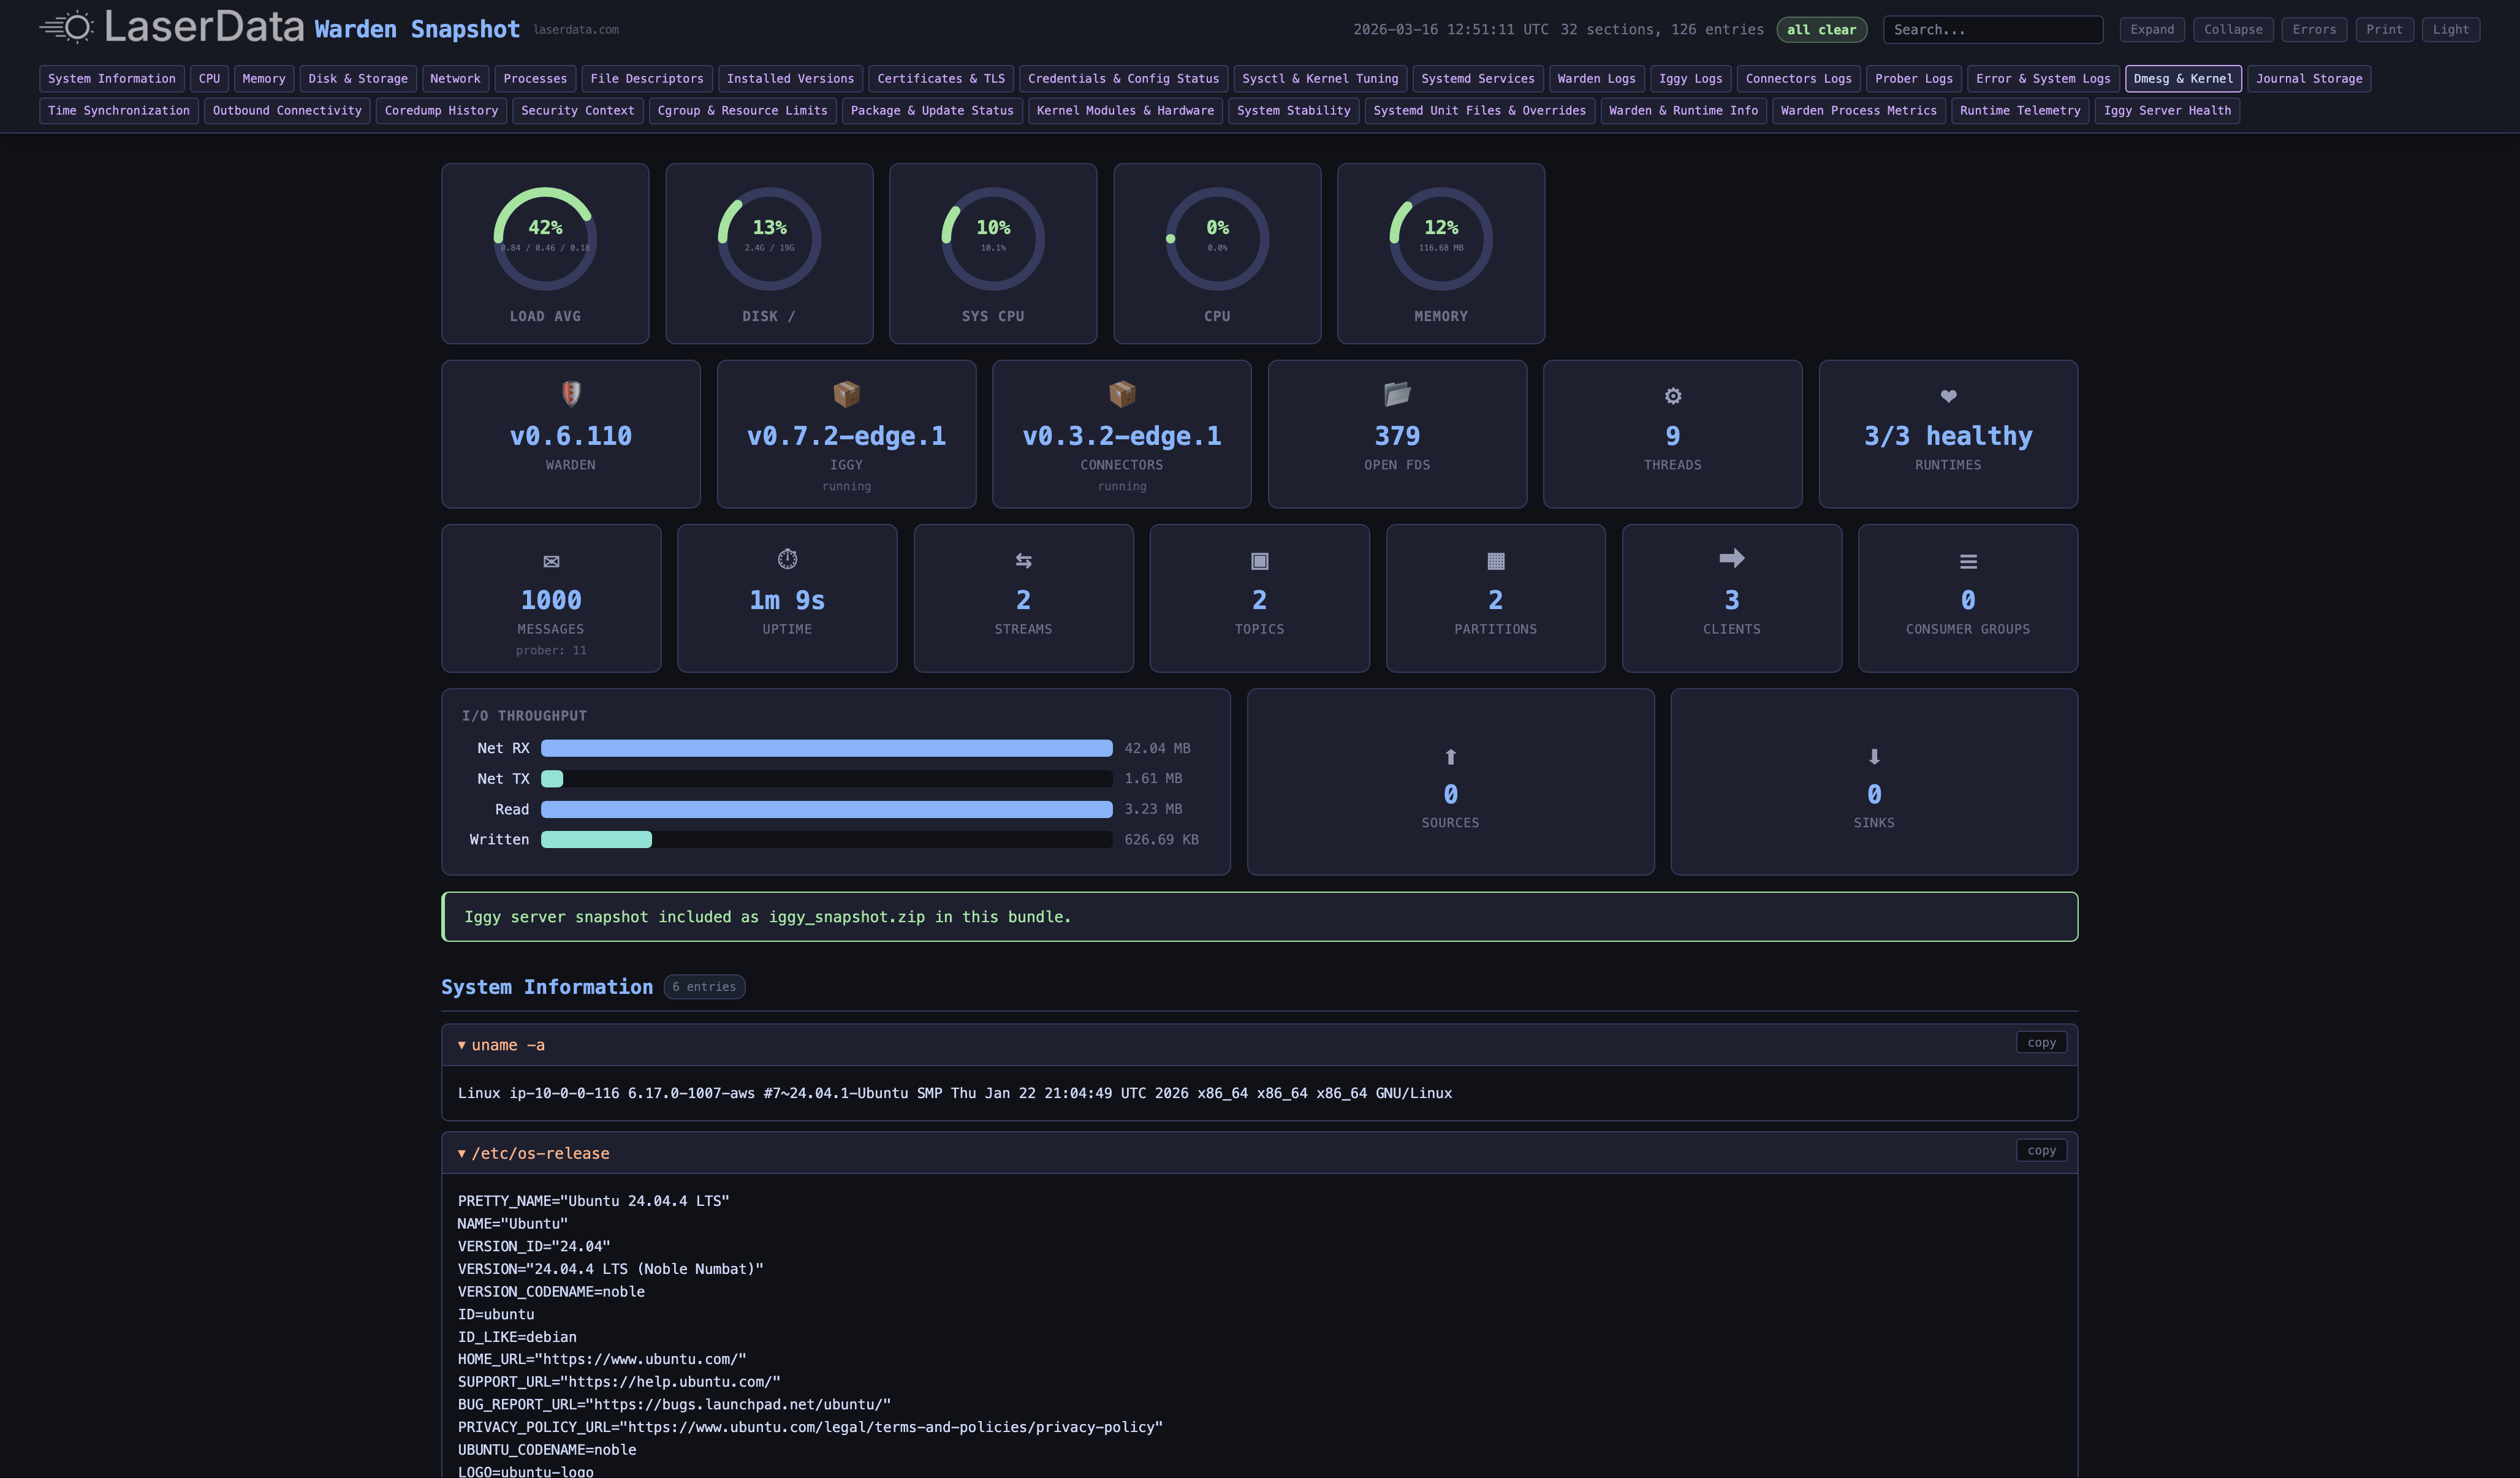
Snapshots capture a comprehensive diagnostic report of your entire deployment node - every runtime, every service, every kernel parameter. The Warden agent runs 30+ diagnostic categories in parallel, collecting system state, runtime health, certificate chains, network configuration, and more - then packages everything into an interactive HTML report you can browse, search, and share.
Open a real snapshot report from a live deployment to explore the full diagnostic output.
What's Captured
Each snapshot runs 30+ diagnostic categories across the node. The Warden agent executes all checks in parallel with timeouts, redacts secrets automatically, and generates a self-contained HTML report with a visual dashboard.
System & Hardware
| Category | What's Collected |
|---|---|
| System Information | OS version, kernel, hostname, cloud metadata (AWS/GCP) |
| CPU | Per-core usage, load average, CPU count, architecture |
| Memory | Usage breakdown, huge pages, NUMA, top consumers, OOM activity |
| Disk & Storage | Filesystem usage, inodes, NVMe health, DRBD status, I/O stats |
| Network | Interfaces, routes, listening ports, iptables, traffic shaping, TCP states |
| Processes | Top consumers by CPU/memory, LaserData process details (PID, threads, FDs, uptime) |
Runtimes & Services
| Category | What's Collected |
|---|---|
| Installed Versions | Warden, Iggy, Connectors, Prober binary versions and capabilities |
| Runtime Telemetry | Per-runtime heartbeats, CPU, memory, uptime, connector sources/sinks |
| Iggy Server Health | Authenticated stats - messages, streams, topics, clients, partitions, consumer groups |
| Systemd Services | Service states, failed units, restart history (24h), timers |
| Warden Process Metrics | CPU/memory/disk/network I/O, file descriptors, thread count |
Security & Certificates
| Category | What's Collected |
|---|---|
| Certificates & TLS | Full chain validation, expiry warnings, CA trust, Let's Encrypt status, ACME renewal |
| Credentials Status | File permissions, ages, PAT freshness (values redacted) |
| Security Context | AppArmor/SELinux, ASLR, entropy, kernel hardening |
Kernel & Stability
| Category | What's Collected |
|---|---|
| Sysctl & Tuning | TCP buffer sizes, memory settings, mimalloc overrides |
| Kernel Modules | Loaded modules, interrupts, softirqs, ECC memory errors |
| System Stability | Reboot history, vmstat, swap activity, zombie detection |
| Coredump History | Crash records (last 30 days) with binary identification |
Logs & Connectivity
| Category | What's Collected |
|---|---|
| Service Logs | Last 2000 lines per runtime (Warden, Iggy, Connectors, Prober) + errors filtered |
| System Logs | Kernel errors, dmesg, boot log errors, journal storage |
| Outbound Connectivity | ACME endpoint, port 80/443 reachability |
| Time Synchronization | NTP/chrony status, time drift |
Interactive Report
The HTML report includes:
- Visual dashboard with CPU, memory, and disk gauges, I/O throughput bars, and Iggy stat cards
- Search across all sections with match highlighting
- Dark and light themes - toggle in the header
- Expand/collapse all sections, or jump to errors only
- Copy buttons on every entry for easy sharing
- Print-friendly layout
How It Works
- You request a snapshot from the Console or API
- The Supervisor dispatches a snapshot task to each node
- The Warden agent on each node runs all diagnostic commands in parallel (30s timeout per command)
- Secrets are automatically redacted from all output
- Results are rendered into a self-contained HTML report
- Optionally, an Iggy server snapshot (data directory state) is bundled as a ZIP
- The report is uploaded to encrypted cloud storage
- You download the snapshot ZIP containing the HTML report and optional Iggy snapshot
Creating a Snapshot
From the Console
- Navigate to your deployment
- Open the Snapshots tab
- Click Create Snapshot
- The snapshot transitions from Processing to Completed once all nodes finish
Options
| Option | Default | Description |
|---|---|---|
redact_secrets | true | Mask sensitive values (passwords, keys, tokens) in the report |
include_iggy | true | Include Iggy server data snapshot as a separate ZIP |
Snapshot Status
| Status | Meaning |
|---|---|
| Processing | Snapshot tasks dispatched, waiting for nodes to complete |
| Completed | All nodes have uploaded their reports - ready to download |
Only one snapshot can be in progress per deployment at a time.
Plan Limits
| Resource | Basic | Pro | Enterprise |
|---|---|---|---|
| Snapshots per deployment | 3 | 5 | 20 |
| Snapshot retention | 7 days | 14 days | 90 days |
Required permission: deployment:read (list, download) or deployment:manage (create, delete)
API Reference
Create a Snapshot
curl -X POST {supervisor_url}/deployments/{deployment_id}/snapshots \
  -H "ld-api-key: YOUR_API_KEY" \
  -H "Content-Type: application/json" \
  -d '{
    "redact_secrets": true,
    "include_iggy": true
  }'
Both fields are optional and default to true.
Returns 204 No Content.
List Snapshots
curl "{supervisor_url}/deployments/{deployment_id}/snapshots?page=1&results=10" \
  -H "ld-api-key: YOUR_API_KEY"
{
"items": [
{
"id": 1,
"tenant_id": 1,
"division_id": 1,
"environment_id": 1,
"deployment_id": 1,
"node_id": 610809900976570889,
"deployment_name": "my-cluster",
"name": "snapshot-20260601-103000",
"status": "completed",
"created_at": "2026-06-01T10:30:00Z",
"completed_at": "2026-06-01T10:31:00Z"
}
],
"page": 1,
"total_results": 1,
"total_pages": 1
}Download a Snapshot
curl {supervisor_url}/deployments/{deployment_id}/snapshots/{snapshot_id}/download \
  -H "ld-api-key: YOUR_API_KEY"
{
"url": "https://storage.example.com/snapshots/...?signature=..."
}Returns a presigned download URL for the snapshot ZIP.
Delete a Snapshot
curl -X DELETE {supervisor_url}/deployments/{deployment_id}/snapshots/{snapshot_id} \
  -H "ld-api-key: YOUR_API_KEY"
Returns 204 No Content.