# Snapshots
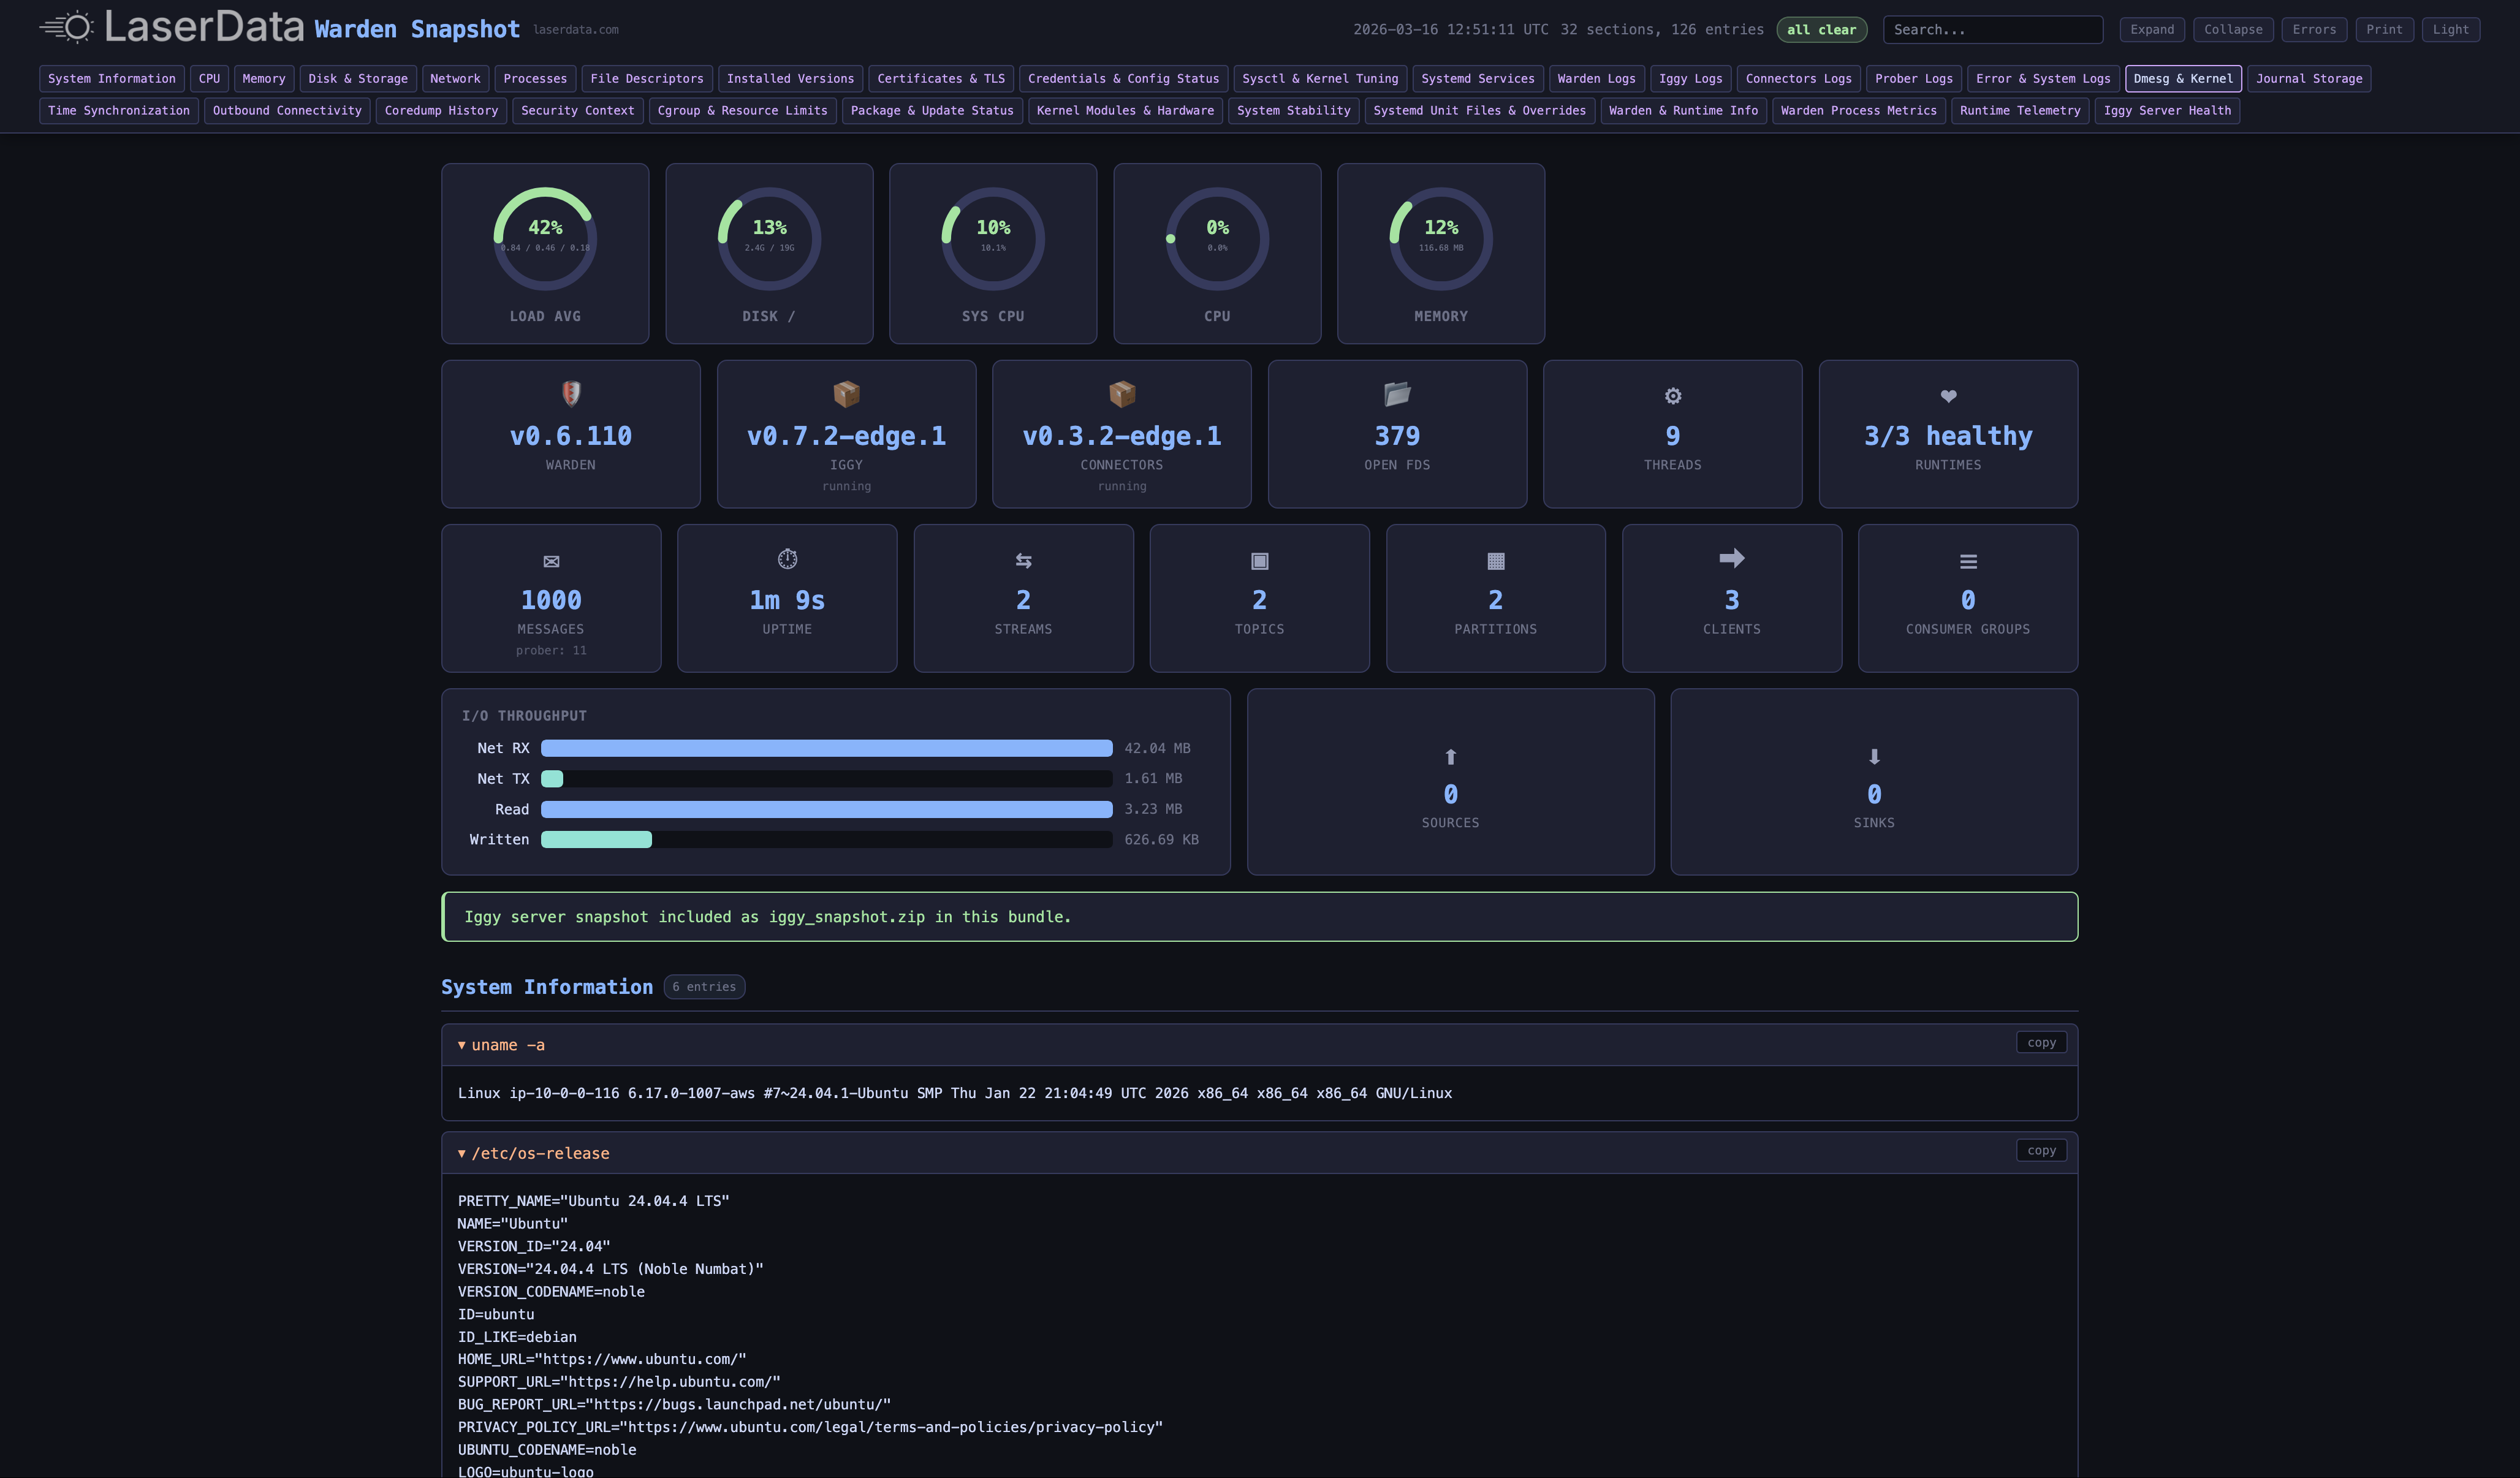
A snapshot records diagnostic information from a deployment node. [Warden](/deployments/warden) collects 30 or more categories, including system state, runtime health, certificates, and network configuration. It packages the results in a self-contained HTML report that you can search and share.
See it in action
Open an example report from a live deployment to see the diagnostic output.
## What Is Captured
Warden runs diagnostic commands in parallel and limits how long each command can run. It removes secrets from the output. The HTML report groups the results into these categories.
### System & Hardware
| Category | What's Collected |
| --- | --- |
| System Information | OS version, kernel, hostname, cloud metadata (AWS/GCP) |
| CPU | Per-core usage, load average, CPU count, architecture |
| Memory | Usage breakdown, huge pages, NUMA, top consumers, OOM activity |
| Disk & Storage | Filesystem usage, inodes, NVMe health, DRBD status, I/O stats |
| Network | Interfaces, routes, listening ports, iptables, traffic shaping, TCP states |
| Processes | Top consumers by CPU/memory, LaserData process details (PID, threads, FDs, uptime) |
### Runtimes & Services
| Category | What's Collected |
| --- | --- |
| Installed Versions | Warden, Iggy, Connectors, Prober binary versions and capabilities |
| Runtime Telemetry | Per-runtime heartbeats, CPU, memory, uptime, connector sources/sinks |
| Iggy Server Health | Authenticated stats - messages, streams, topics, clients, partitions, consumer groups |
| Systemd Services | Service states, failed units, restart history (24h), timers |
| Warden Process Metrics | CPU/memory/disk/network I/O, file descriptors, thread count |
### Security & Certificates
| Category | What's Collected |
| --- | --- |
| Certificates & TLS | Full chain validation, expiry warnings, CA trust, Let's Encrypt status, ACME renewal |
| Credentials Status | File permissions, ages, PAT freshness (values redacted) |
| Security Context | AppArmor/SELinux, ASLR, entropy, kernel hardening |
### Kernel & Stability
| Category | What's Collected |
| --- | --- |
| Sysctl & Tuning | TCP buffer sizes, memory settings, mimalloc overrides |
| Kernel Modules | Loaded modules, interrupts, softirqs, ECC memory errors |
| System Stability | Reboot history, vmstat, swap activity, zombie detection |
| Coredump History | Crash records (last 30 days) with binary identification |
### Logs & Connectivity
| Category | What's Collected |
| --- | --- |
| Service Logs | Last 2000 lines per runtime (Warden, Iggy, Connectors, Prober) + errors filtered |
| System Logs | Kernel errors, dmesg, boot log errors, journal storage |
| Outbound Connectivity | ACME endpoint, port 80/443 reachability |
| Time Synchronization | NTP/chrony status, time drift |
### Interactive Report
The report includes these tools:
* A dashboard with CPU, memory, disk, I/O throughput, and Iggy statistics.
* Search across sections, with matching text highlighted.
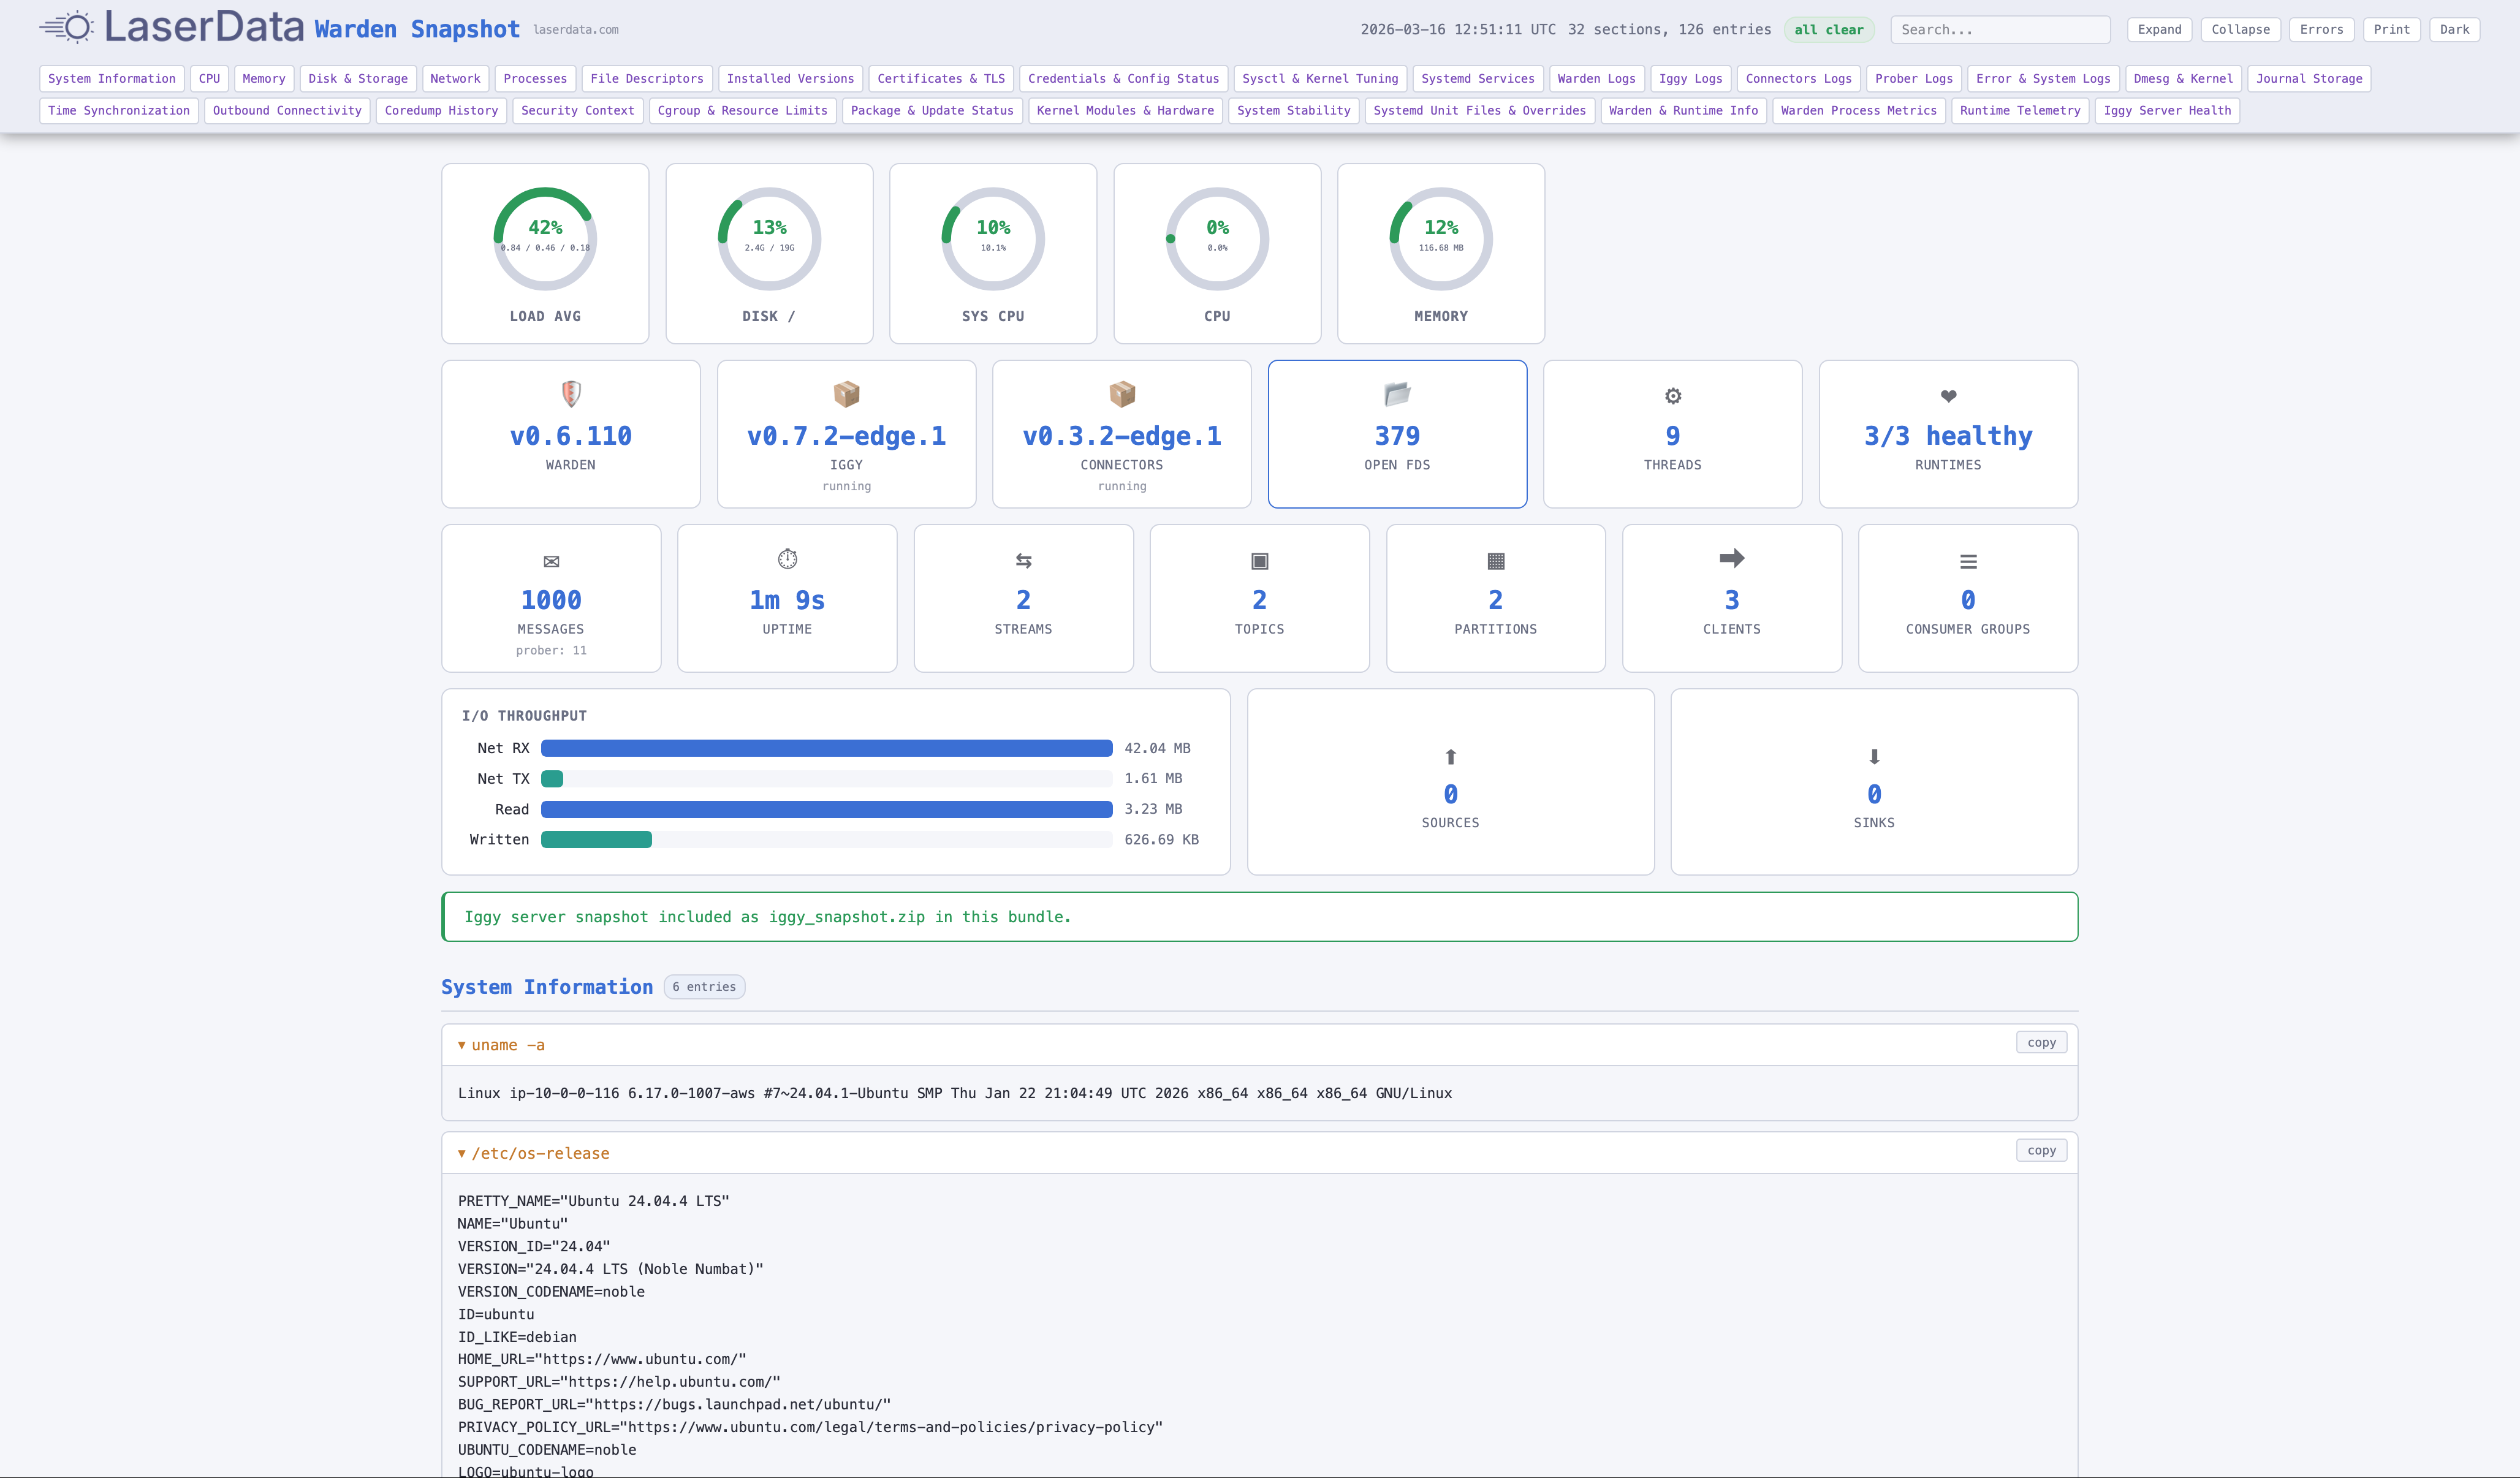
* Dark and light themes, selected in the header.
* Controls to expand or collapse sections and find errors.
* A copy button for each entry.
* A layout for printing.
## How It Works
A snapshot follows this sequence:
1. You request it through the Console or API.
2. The Supervisor sends a snapshot task to each node.
3. Warden runs diagnostic commands in parallel, with a 30s timeout for each command.
4. Warden removes secrets from the output.
5. Warden creates the HTML report.
6. If requested, it includes an Iggy snapshot of the data directory as a ZIP.
7. It uploads the report to encrypted cloud storage.
8. You download the ZIP with the report and optional Iggy snapshot.
## Creating a Snapshot
### From the Console
1. Open your deployment in the Console.
2. Open the Snapshots tab.
3. Click Create Snapshot.
The status changes from Processing to Completed after all nodes finish.
### Options
| Option | Default | Description |
| --- | --- | --- |
| `redact_secrets` | `true` | Mask sensitive values (passwords, keys, tokens) in the report |
| `include_iggy` | `true` | Include Iggy server data snapshot as a separate ZIP |
## Snapshot Status
| Status | Meaning |
| --- | --- |
| Processing | Snapshot tasks dispatched, waiting for nodes to complete |
| Completed | All nodes have uploaded their reports - ready to download |
Only one snapshot can run for a deployment at a time.
## Plan Limits
| Resource | Standard | Performance | Enterprise |
| --- | --- | --- | --- |
| Snapshots per deployment | 3 | 5 | 20 |
| Snapshot retention | 7 days | 14 days | 90 days |
Reading and downloading snapshots require `deployment:read`. Creating or deleting them requires `deployment:manage`.
## API Reference
### Create a Snapshot
```bash
curl -X POST {supervisor_url}/deployments/{deployment_id}/snapshots \
-H "ld-api-key: YOUR_API_KEY" \
-H "Content-Type: application/json" \
-d '{
"redact_secrets": true,
"include_iggy": true
}'
```
Both fields are optional and default to `true`. A successful request returns `204 No Content`.
### List Snapshots
```bash
curl "{supervisor_url}/deployments/{deployment_id}/snapshots?page=1&results=10" \
-H "ld-api-key: YOUR_API_KEY"
```
```json
{
"items": [
{
"id": 1,
"tenant_id": 1,
"workspace_id": 1,
"environment_id": 1,
"deployment_id": 1,
"node_id": 610809900976570889,
"deployment_name": "my-cluster",
"name": "snapshot-20260601-103000",
"status": "completed",
"created_at": "2026-06-01T10:30:00Z",
"completed_at": "2026-06-01T10:31:00Z"
}
],
"page": 1,
"total_results": 1,
"total_pages": 1
}
```
### Download a Snapshot
```bash
curl {supervisor_url}/deployments/{deployment_id}/snapshots/{snapshot_id}/download \
-H "ld-api-key: YOUR_API_KEY"
```
```json
{
"url": "https://storage.example.com/snapshots/...?signature=..."
}
```
The response contains a presigned URL, a temporary authorized download link, for the snapshot ZIP.
### Delete a Snapshot
```bash
curl -X DELETE {supervisor_url}/deployments/{deployment_id}/snapshots/{snapshot_id} \
-H "ld-api-key: YOUR_API_KEY"
```
A successful request returns `204 No Content`.
- [Deployment Models](/deployments)
- [Monitoring](/observability)
- [Warden Agent](/deployments/warden)
Source: https://docs.laserdata.com/deployments/snapshots